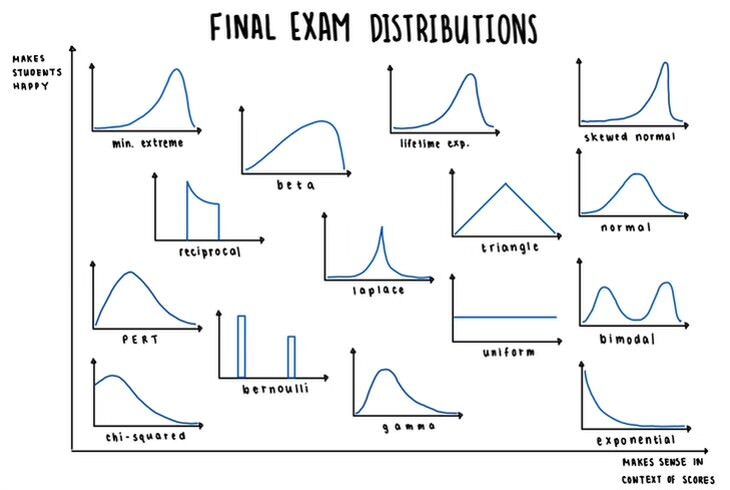
MIT technically does not curve, but many classes will define cutoffs relative to class performance: hence, increased happiness when everyone scores poorly together.
MIT technically does not curve, but many classes will define cutoffs relative to class performance: hence, increased happiness when everyone scores poorly together.


